You can’t move what you can’t measure. In order for your marketing to work you need a real estate investor marketing KPI spreadsheet.
Your marketing is the lifeblood of your business. You need a consistent stream of leads coming to you looking to buy and sell properties.
How do you track what source of visitors are converting on your website? Which ones turn into the best leads? How many deals have you closed from Google?
Most, if not all of this data is available in Google Analytics. The tool itself is great and super powerful. But there is a learning curve.
If you are a Carrot member you have some of this data built into your website automatically.
But tracking the data and learning from it is where a lot of real estate investor fall short.
Why you need a real estate investor marketing KPI spreadsheet
You need to start tracking your marketing effectiveness. The best way to do that is with a simple spreadsheet that helps you see your month over month trends and how they support your yearly goals.
I create REI Scorecard (https://reiscorecard.com/) as a simple website to give a free template to any real estate investor looking to track their marketing data.
What is included in the KPI spreadsheet?
I am a big believer that all process needs documentation. To start you will notice the spreadsheet template has some helpful docs teaching you how to use it.
Key Performance Indicators (KPIs)
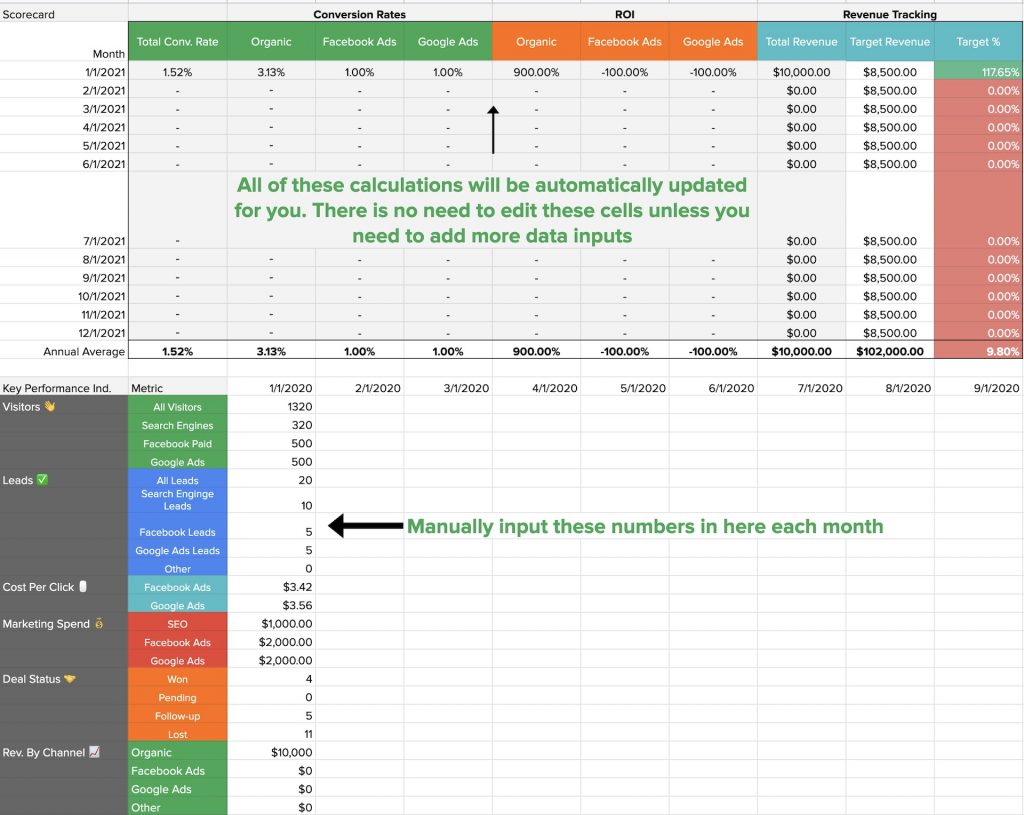
You will also see a tab called KPIs. These are the major levelers in your business. For real estate investors, those are
- Visitors to your website
- Leads that are converted from your website traffic
- Deals closed from your leads
- Revenue earned from your deals
This part of the template allows you to manually put that information in month over month to see which channels are performing well or where there is room for improvement.
Scorecard
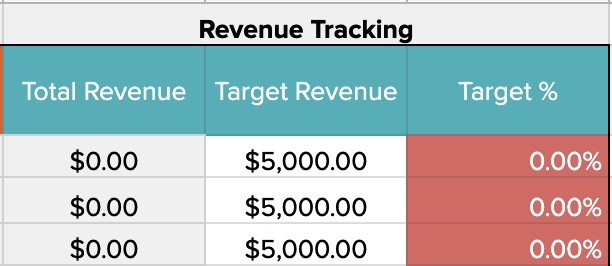
KPIs are great for measuring data in a retroactive manner. That is to say, you see what you completed last month. However, data can be used to forecast and see into the future. That is where the scorecard comes into play. The scorecard allows you to set yearly targets and see where you are in relation to those goals.
If you are at 90% of your revenue target in November, you can be fairly confident you will reach your revenue goals. The KPI/Scorecard view is a good balance of what have I done and what do I still need to do.
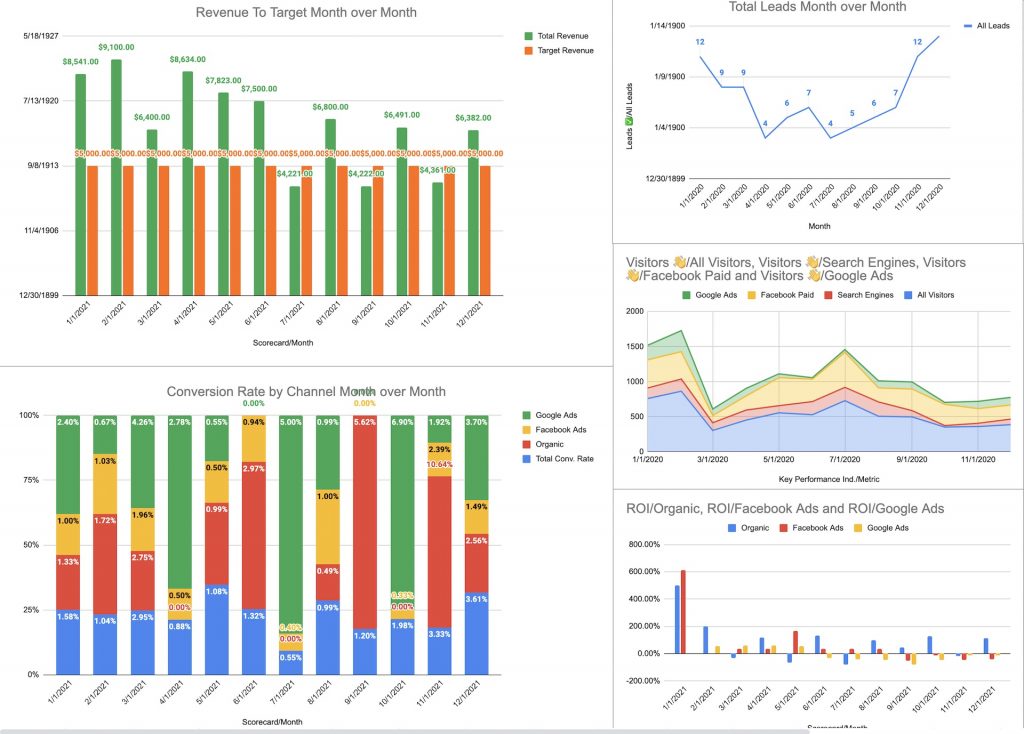
Dashboards
Everyone learns differently. Some real estate investors want to see the raw data. For others, they want to see a chart or graph to give them the relational data in a visual way.
This real estate investor marketing KPI spreadsheet has a tab with some useful charts to visualize the data on a monthly basis.
You can adjust these as you see fit.
They are a great starting point to quickly see trends and where you are over or under on marketing effectiveness.
Grab Your KPI Spreadsheet
This is 100% free and something that I hope helps you make your marketing more effective. If you have thoughts on how I can make this better, drop me a line and I would be happy to make this spreadsheet more useful.